Fundamental Environment
The price of gold is rising after a slight previous decline and remains near the high of the last two weeks. This trend is attributed to the weakness of the US dollar, influenced by a new decrease in US Treasury bond yields. Additionally, geopolitical tensions in the Middle East continue to support demand for the metal as a haven.
However, the price of gold is expected to be limited due to expectations of a firmer stance by the Federal Reserve. Recent FOMC meeting minutes and comments from Fed officials suggest a willingness to keep interest rates high, which could boost Treasury bond yields and strengthen the dollar. This could discourage aggressive bets in favour of gold.
Attention will be paid this week to key US macroeconomic data, such as durable goods orders and the consumer confidence index, which will be released today, Tuesday, February 27. The Personal Consumption Expenditures (PCE) Price Index on Thursday is shaping up to be a crucial event that could influence Fed outlooks and, consequently, the direction of the gold price.
Daily Chart Analysis. Volume Profile and Structure.Macro Situation: BullishTechnical Structure:
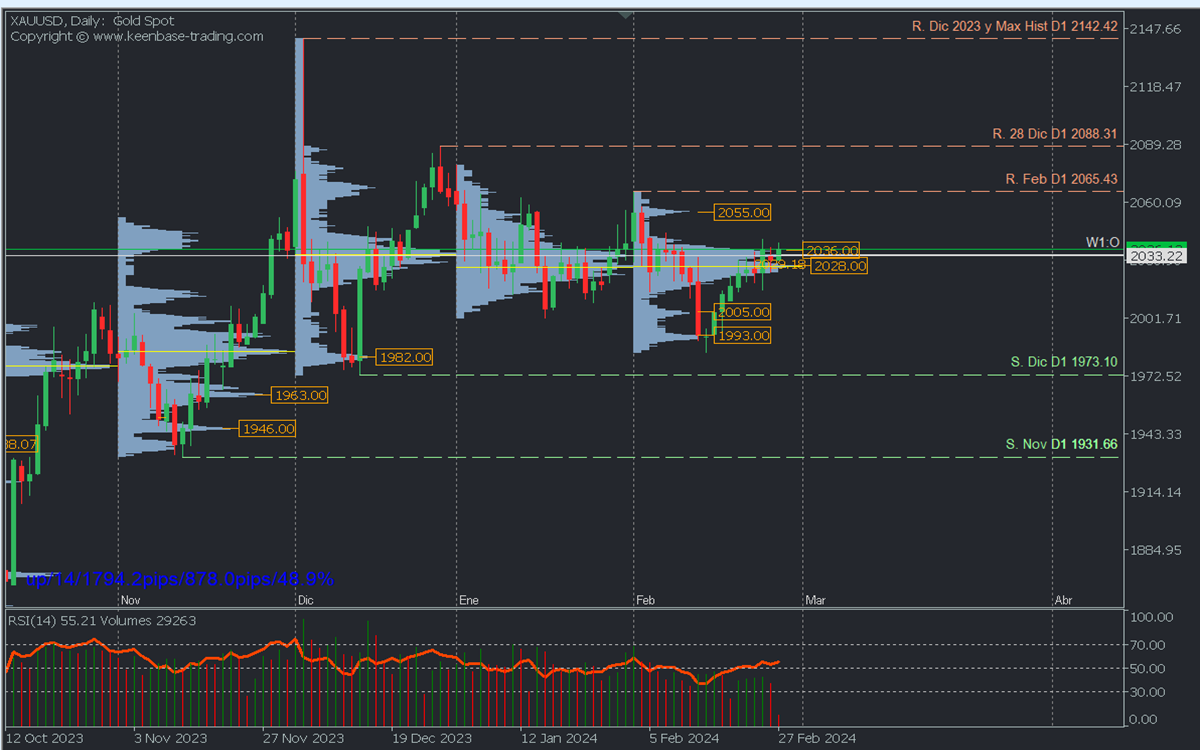
XAUUSD continues within a macro bullish trend, even after reaching the historic high in December at 2142.42. The last relevant support is the November low at 1931.66. The current consolidation has not yet reversed this trend until the last mentioned support is decisively broken or confirmed with two movements.
Volume Profile Structure: The consolidation has left high volume concentrations in common areas between December and February. POCs* are around 2033/2028 in the monthly volume profile, forming a distribution zone from where sales will be activated in the short term if prices fall and remain below the mentioned POCs. This confirms the accumulation of sell orders, opening the door to further decline.
Corrective Bearish Scenario: This scenario will be activated with prices below 2028/2025, seeking February buying zones in high-volume nodes between 2005 and 1993. A decisive break will indicate bear dominance and continue the descent towards the buying zones and support levels, such as the December volume node around 1982 and the December support at 1973.10.
Bullish Scenario: In an environment of uncertainty, the gold rebound in the coming months cannot be ruled out if fundamentals support buying liquidity. This will be evident in the price chart with quotes above the volume concentration between 2030/2035. The first February selling zone, around 2055, may reactivate bears to defend that zone and cause a new decline towards 2033, where a new rebound or a further decline will be determined.
Only the decisive break of the selling zones indicates bullish dominance, and the challenge and break of the high volume node at 2055 and resistances 2065.43 and 2088.3 are required, only to consider the possibility of gold covering the volume inefficiency (Gap in the profile) left on December 4 until reaching the current historic high at 2142.42.
The oscillating RSI around the midpoint currently confirms the bullish momentum of the last few days with ascending vertical volume and exhaustion in the last two days. This indicates local consolidation awaiting key USD fundamentals.
What is the possibility of an extension of the bearish correction to challenge a change?
If prices acquire greater bearish strength and leave decisive breaks in their path, the price will likely continue to decline in the coming months towards the high volume nodes of November between 1963 and 1946. This could occur before reaching the key November support at 1931.66 and reversing the trend after its confirmed break with a second minimum.
This macro scenario must be accompanied by a fundamental environment of the absence of high-impact geopolitical events that provoke risk aversion and the consequent rush towards gold as a haven asset.
*Uncovered POC: POC = Point of Control: It is the level or zone where the highest volume concentration occurred. If previously, from it, there was a bearish movement, it is considered a selling zone and forms a resistance zone. On the contrary, if previously, there was a bullish impulse, it is considered a buying zone, usually located at lows, forming support zones.
I always publish daily intraday analyses on Gold (XAUUSD) on the telegram channel: FBS Analysis in Spanish.
Disclaimer
This document does not constitute a recommendation to buy or sell financial products and should not be considered a solicitation or offer to participate in transactions. This document is economic research by the author and is not intended to provide investment advice or solicit securities or other types of investment transactions at FBS. While every investment carries some degree of risk, the risk of loss in trading currencies and other leveraged assets can be substantial. Therefore, if you are considering trading in this market, you should be aware of the risks associated with this product to make informed decisions before investing. The material presented here should not be interpreted as advice or trading strategy. All prices mentioned in this report are for informational purposes only.