

US500: A further correction towards 5192 before resuming purchases.
Bearish Scenario: Sales below 5220... Bullish Scenario: Buys above 5225 (if price fails to break below decisively) ...
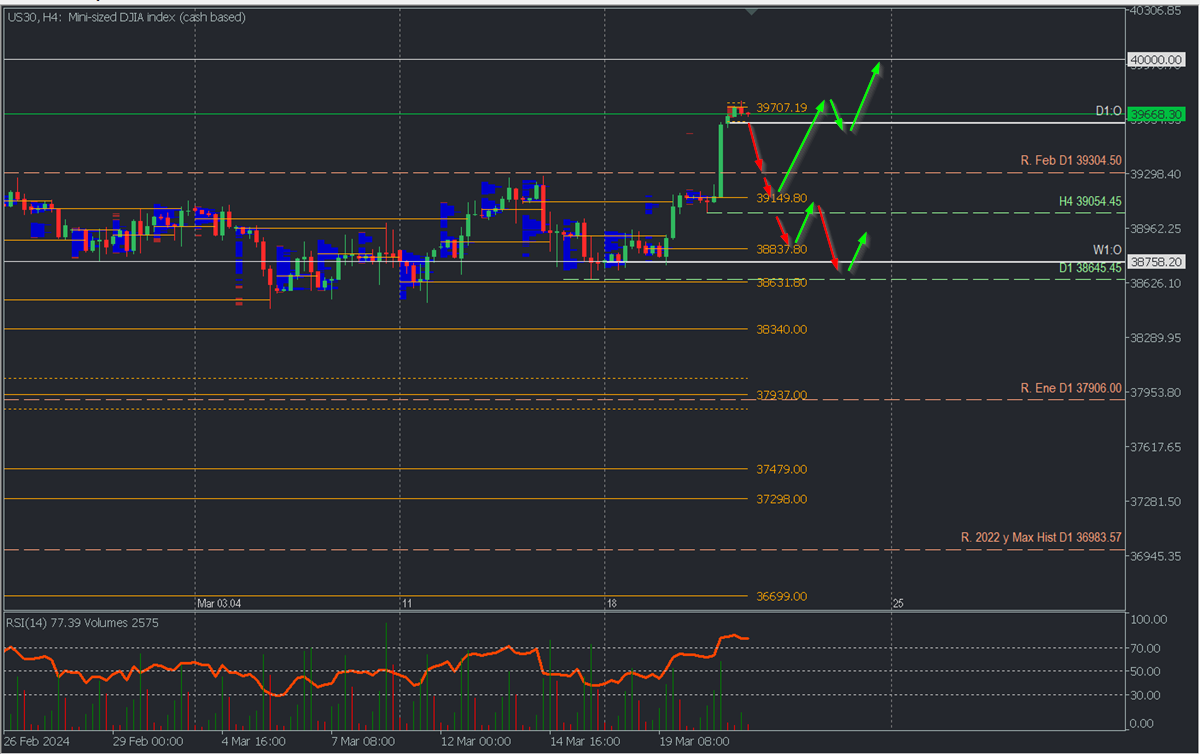
2024-03-21 • Updated
Bearish Scenario: Sell below 39600 with TP1: 39300, TP2: 39235, and TP3: 39150 with S.L. above 39750 or at least 1% of account capital*. Only a breakout of support at 39054.45 will extend sales towards 38950 and 38850.
Anticipated Bullish Scenario: Intraday longs above 39750 with TP: 40000 with S.L. below 39630 or at least 1% of account capital*. Apply a trailing stop.
Bullish Scenario after Retracement: Longs above 39150 with TP: 39300, TP2: 39500, and TP3: 39700, with S.L. below 39000 or at least 1% of account capital*. Apply a trailing stop.
The US30 index (Dow Jones) reached a new all-time high at 39746.80 after the recent Fed meeting, resulting in a 1.73% surge solely in yesterday's American session and a 2.66% increase since the beginning of the week.
This ascent confirms the continuation of the bullish trend, leaving the last relevant support at the level of 39054.45, implying that this trend will remain active as long as the indicated support is not decisively broken or with two confirmation moves, considering the round level of 40000 as the next buying target.
Under the current scenario, there's an accumulation of volume around 39707.19, indicating the formation of a selling zone reflecting bear entry to cause a descent, at least towards the February broken resistance and previous all-time high at 39304.50, and even seeking liquidity towards the last buying zone around 39150, from where considering a new entry by the bulls for a new bullish expansion towards 40000.
If the quotes break the point of control (POC) during the initial sessions at 39707.19, it suggests that the bulls still have the upper hand, which may cause the price to move towards 39800 and 39900. This move might happen without any correction to address the volume inefficiency left after yesterday's surge.
On the other hand, an aggressive descent and the consequent decisive break not only of the buying zone but also of the support at 39054.45, will cause a bearish reversal with targets in the buying zones below it between 38838 and 38632 with an expected retracement from each of them.
Indicators: The overbought RSI may begin to decline to seek a new balance around the midpoint, confirming the start of the correction. The vertical volume has been showing increasing volume on each ascent of the week, so the retracement should show decreasing volume supporting the expected short correction.
*POC (Point of Control) = Point of Control - Orange lines: It is the level or zone where the highest volume concentration occurred. If there was a bearish movement from it previously, it is considered a selling zone and forms a resistance zone. Conversely, if there was a bullish impulse previously, it is considered a buying zone, usually located at lows, forming support zones.
Risk Management Suggestion: It is essential that risk management be based on capital and traded volume. For this, a maximum risk of 1% of capital is recommended. It is suggested to use risk management indicators such as the Easy Order.
Disclaimer and Risk Warning: This document does not constitute a recommendation to buy or sell financial products and should not be considered a solicitation or offer to engage in transactions. This document is economic research by the author and is not intended to provide investment advice or solicit securities transactions or other investments in FBS. While every investment involves some risk, the risk of loss in trading forex and other leveraged assets can be substantial. Therefore, if you are considering trading in this market, you should be aware of the risks associated with this product to make informed decisions before investing. The material presented here should not be construed as trading advice or strategy. All prices mentioned in this report are for informational purposes only.

Bearish Scenario: Sales below 5220... Bullish Scenario: Buys above 5225 (if price fails to break below decisively) ...

Bearish scenario: Shorts below 18100 with TP1: 17900... Anticipated bullish scenario: Intraday Longs above 18130 with TP...

Bullish Scenario: Buys above 17910 with TP:18098.07, TP2:18277, and TP3: 18415 Bearish Scenario: Sells below 17850 with TP1:17730, TP2: 17700

Jerome H. Powell, the Federal Reserve chair, stated that the central bank can afford to be patient in deciding when to cut interest rates, citing easing inflation and stable economic growth. Powell emphasized the Fed's independence from political influences, particularly relevant as the election season nears. The Fed had raised interest rates to 5.3 ...

Hello again my friends, it’s time for another episode of “What to Trade,” this time, for the month of April. As usual, I present to you some of my most anticipated trade ideas for the month of April, according to my technical analysis style. I therefore encourage you to do your due diligence, as always, and manage your risks appropriately.

Bearish scenario: Sell below 1.0820 / 1.0841... Bullish scenario: Buy above 1.0827...
FBS maintains a record of your data to run this website. By pressing the “Accept” button, you agree to our Privacy policy.
Your request is accepted.
A manager will call you shortly.
Next callback request for this phone number
will be available in
If you have an urgent issue please contact us via
Live chat
Internal error. Please try again later
Don’t waste your time – keep track of how NFP affects the US dollar and profit!
|


