-
How to open an FBS account?
Click the ‘Open account’ button on our website and proceed to the Personal Area. Before you can start trading, pass a profile verification. Confirm your email and phone number, get your ID verified. This procedure guarantees the safety of your funds and identity. Once you are done with all the checks, go to the preferred trading platform, and start trading.
-
How to start trading?
If you are 18+ years old, you can join FBS and begin your FX journey. To trade, you need a brokerage account and sufficient knowledge on how assets behave in the financial markets. Start with studying the basics with our free educational materials and creating an FBS account. You may want to test the environment with virtual money with a Demo account. Once you are ready, enter the real market and trade to succeed.
-
How to withdraw the money you earned with FBS?
The procedure is very straightforward. Go to the Withdrawal page on the website or the Finances section of the FBS Personal Area and access Withdrawal. You can get the earned money via the same payment system that you used for depositing. In case you funded the account via various methods, withdraw your profit via the same methods in the ratio according to the deposited sums.
Trend
One of the assumptions of technical analysis is that the price moves in trends. Let’s find out more about these trends.
A trend is the general direction of the price of an asset on the market. If you look at a chart of any financial instrument, you will see that prices never move in straight lines, they are constituted of a series of highs and lows. More often than not, a price has an upward or downward bias.
Types of trend
There are three types of trends:
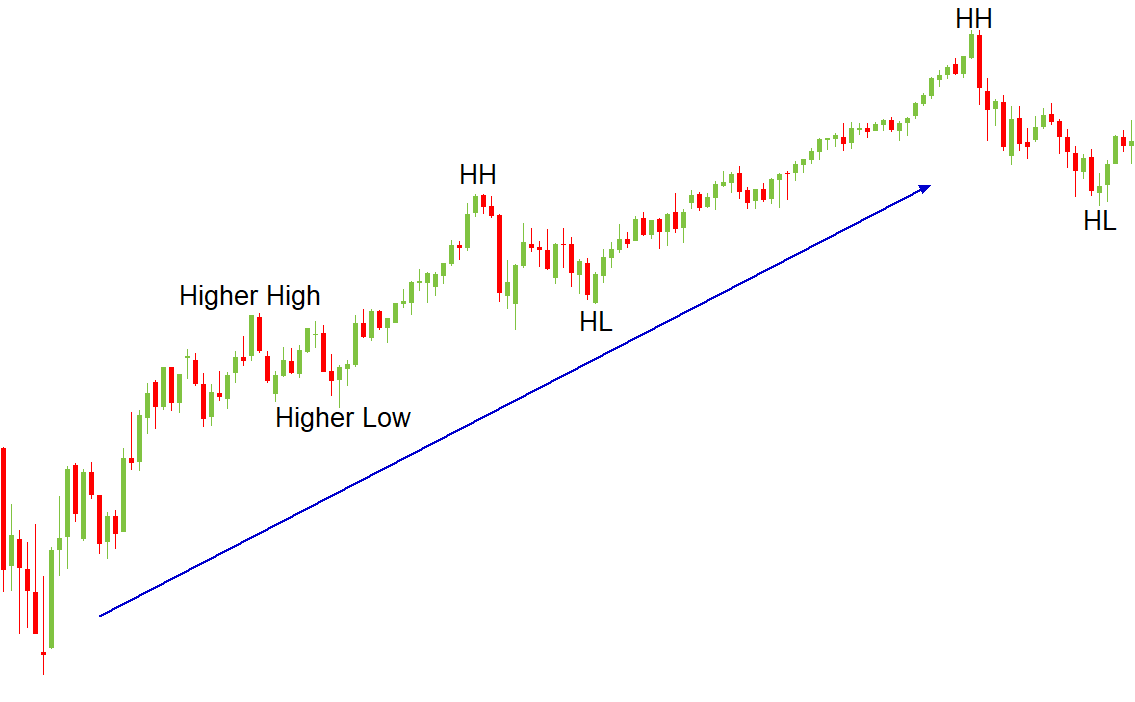
- An uptrend (bullish trend) consists of a series of higher highs and higher lows (prices are moving up). One may speak about an uptrend if there is a clear support line, connecting at least two lows and limiting the downside. A break below this line signals the trend's weakness or reversal.
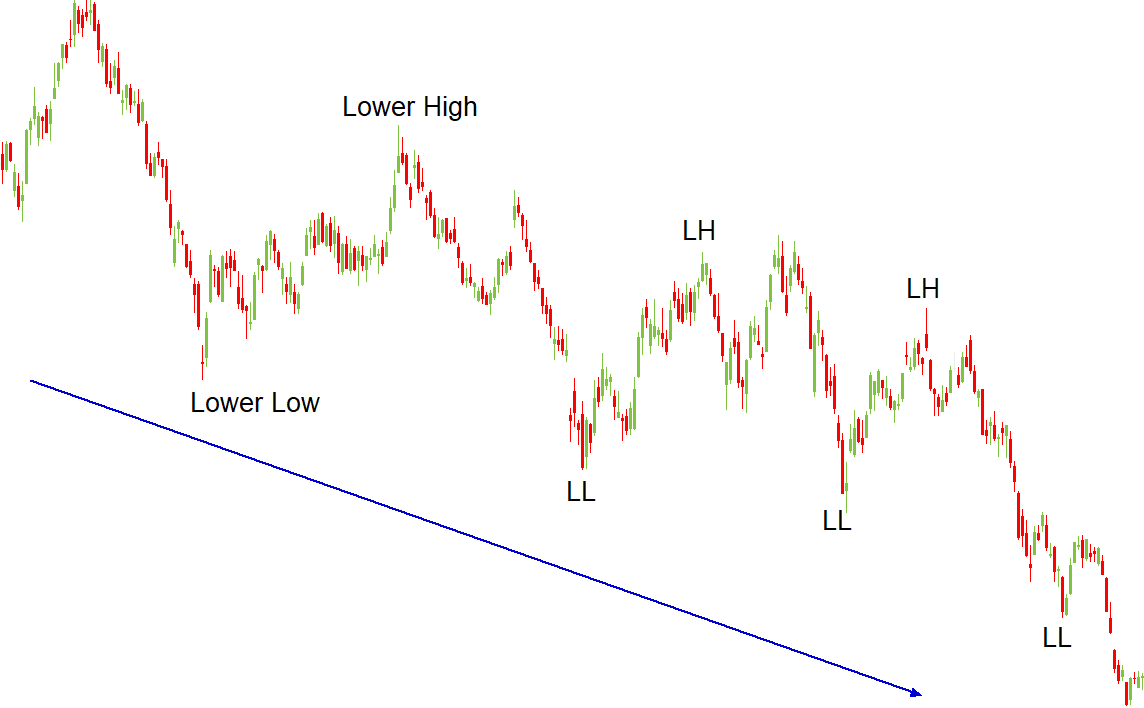
- A downtrend (bearish trend) is classified as a series of lower lows and lower highs (prices are moving down). A downtrend can be defined if there is a clear resistance line, connecting at least two highs and limiting the upside. A break below this line signals the trend's weakness or reversal.
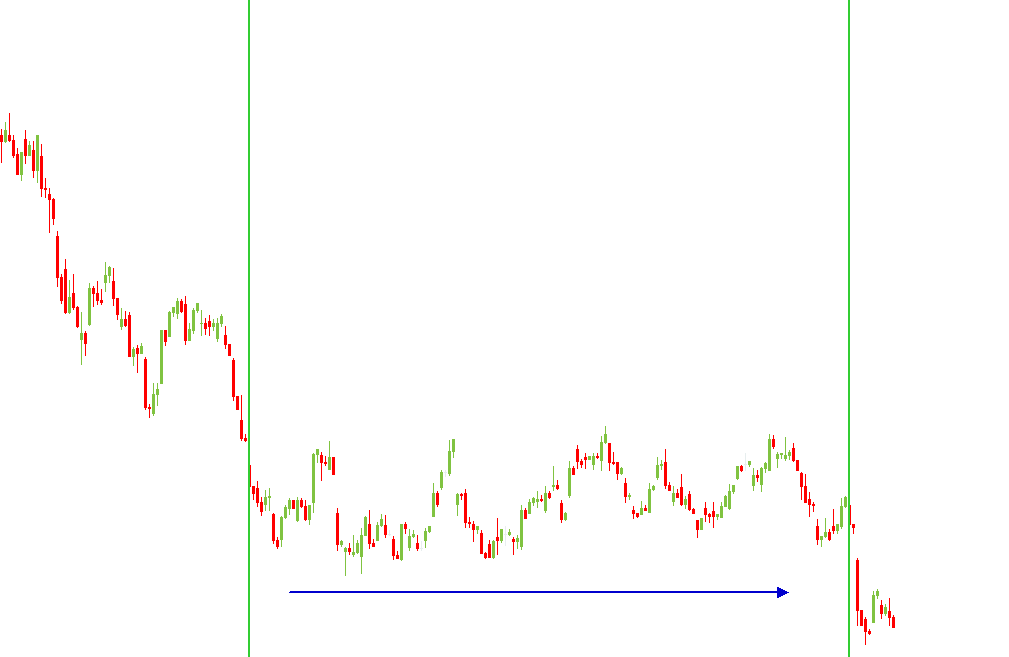
- Sideways (flat, horizontal) trend – there is no well-defined trend in either direction.
In terms of length, trends can be classified as follows:
- Long-term (6 months – 2.5 years) – a major trend that can be traced on weekly or monthly charts. It is composed of several medium-term and short-term trends, which often move against the direction of the major trend.
- Medium-term (1 week – a couple of months) is better seen on the daily and H4 charts.
- Short-term (less than a week) is better seen on hourly and minute charts.
Every trend consists of movements in the direction of this trend which are intermitted by counter-trend moves called “retracements” or “corrections.” A trend is expected to continue until a reversal takes place and the direction of a trend changes.
Trendline
A favorite saying of traders is, “A trend is your friend.” The idea behind this phrase is that traders can make good profits by following a trend, i.e., trading in the direction of a trend (buying during an uptrend and selling during a downtrend).
In order to determine which trend is there in the market, traders draw trendlines and use technical indicators.
A trendline is a line drawn through pivot highs or pivot lows of the price chart to show the prevailing direction of the price. As such a line connects the already formed peaks and troughs of the price, it can be continued (projected) to the right of the current price. It’s assumed that this line will be an obstacle to the price in the future.
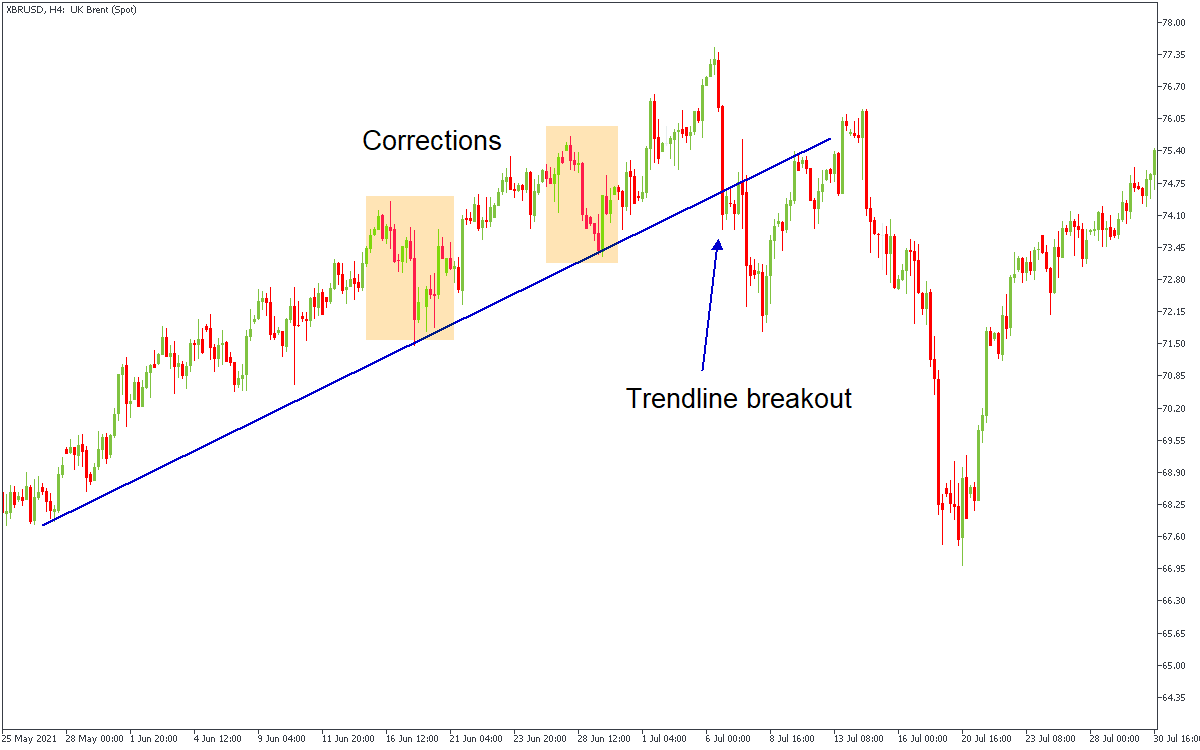
In the picture above, you can see the trendline drawn through a price’s low and a higher low in an uptrend. The price respected the trendline for some time, continuing to move within a rising trend. Then it broke below the trendline. This was a sign that the uptrend finished and the market reversed down. Those traders who opened buy trades during the uptrend closed their positions and opened sell trades.
Successful trend following trading

2023-02-03 • Updated
Other articles in this section
- The McClellan Oscillator
- Aroon Indicator Trading Strategy
- Currency strength
- Moving Averages Ribbon: How to Find Entry Point
- Best Time Frames for Trading
- Renko charts Japanese candlestick chart
- Types of charts
- How to Use a Heikin-Ashi Chart?
- Quantitative Easing Policy (QE)
- Pivot Points
- What Is a ZigZag Indicator?
- Moving Average
- Williams’ Percent Range (%R)
- What Is Relative Vigor Index (RVI Indicator)?
- Momentum
- Force index
- What Is Envelopes Indicator?
- Bulls Power and Bears Power
- Average True Range
- How to trade on central bank decisions?
- CCI (Commodity Channel Index)
- Standard deviation
- Parabolic SAR
- Trading with Stochastic Oscillator
- Relative Strength Index
- MACD (Moving Average Convergence/Divergence)
- Oscillators
- ADX Indicator: How To Use It For Effective Forex Trend Analysis
- Bollinger bands
- Trend indicators
- Introduction to technical indicators
- Support and resistance
- Technical analysis
- Central Banks: policy and effects
- Fundamental factors
- Fundamental Analysis in Forex and stock trading
- Fundamental vs technical analysis


