If you are familiar with the price action method, you should know the “Third candle” pattern. The pattern is proven to be simple and effective for traders. In this article, we are going to consider the strategy, which is based on this pattern.
What is the “Third candle” pattern?
The pattern that we are going to explain is a reversal one. Traders often confuse it with the “Three black crows” or the “Three white soldiers” patterns. The main difference between them is that the “Third candle” pattern has fewer restrictions concerning the opening price of each candlestick.
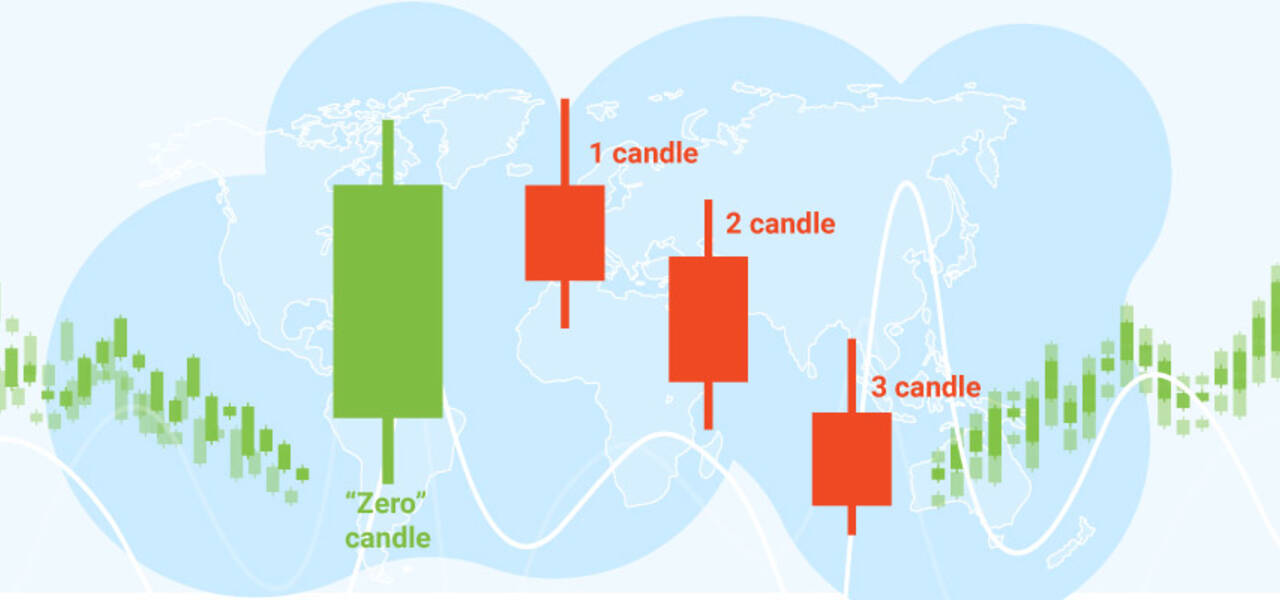
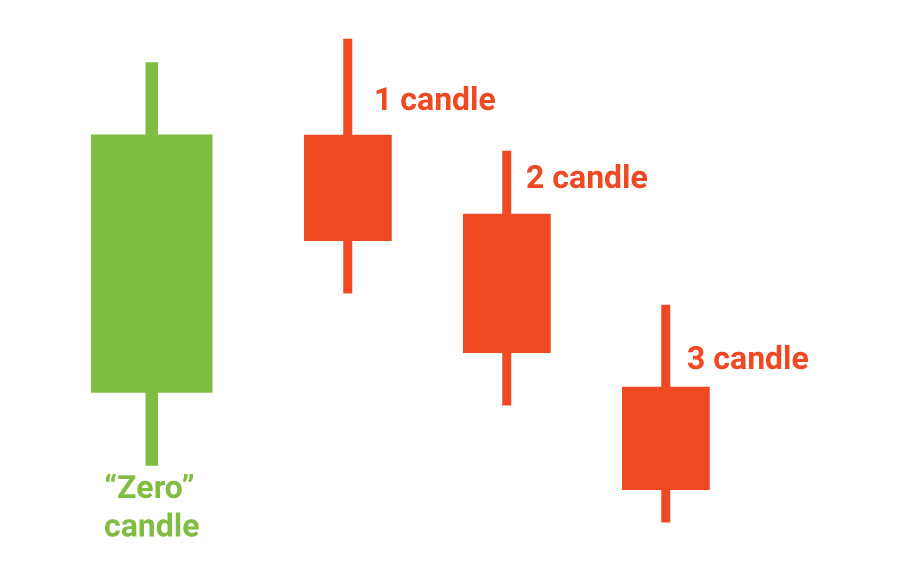
The formation of a bearish pattern that signals the reversal to the downside begins with a bearish candle (1st candle on the picture) with a higher high which should follow the bullish (“zero”) candlestick. After that, we wait for the second bearish candle which confirms the downward movement. When it is closed we may say that the pattern is implemented on the chart. The third candle is used for opening a short position.
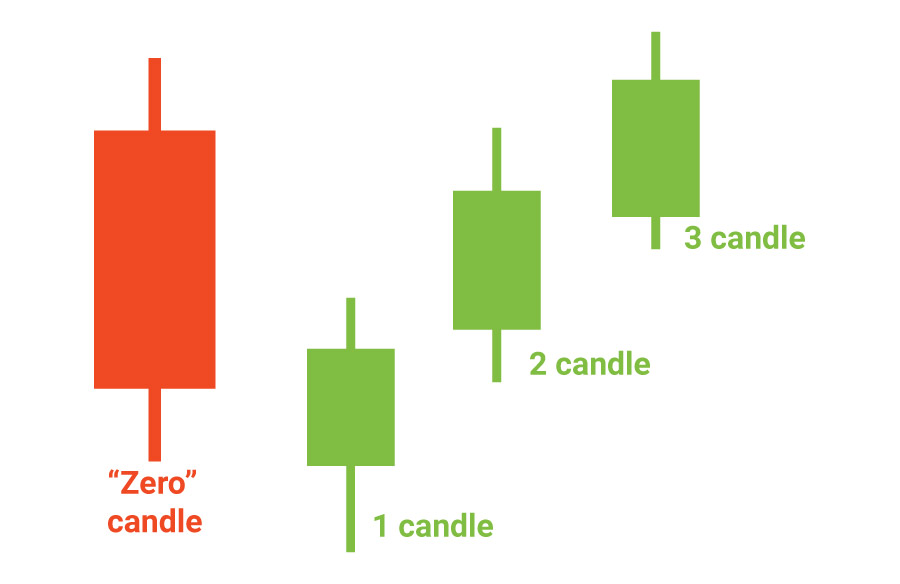
Vice versa, we identify the bullish pattern. The first bullish candlestick should appear after the bearish one (“zero”). It should have a lower low. The second bullish candlestick is used as a confirmation of the reversal to the upside. The opening price of the third candlestick is the level where we open a long position.
Now, let's look at the algorithm of the strategy.
The basic elements:
It’s recommended to implement the strategy during the European and American trading sessions on the intraday timeframes. Also, you should add a stochastic indicator (5, 3, 3) to your chart as a filter.
A long position’s setup
- At first, we are waiting for the implementation of the bullish "Third candle" pattern.
- If the bodies of the first and second candles are very small – you shouldn’t enter the market, because it shows that bulls are losing their strength.
- Secondly, we look at the Stochastic oscillator. Its lines should move up.
- If all conditions are met, we enter a long position at the opening price of the third candlestick.
- We place a stop loss below the low of the first candlestick.
- We recommend to trail the level of take profit and close the position when you see the signs of the reversal to the downside (a crossover of the Stochastic oscillator in the overbought zone or reaching the strong resistance level).
Below we provided an example of the strategy.
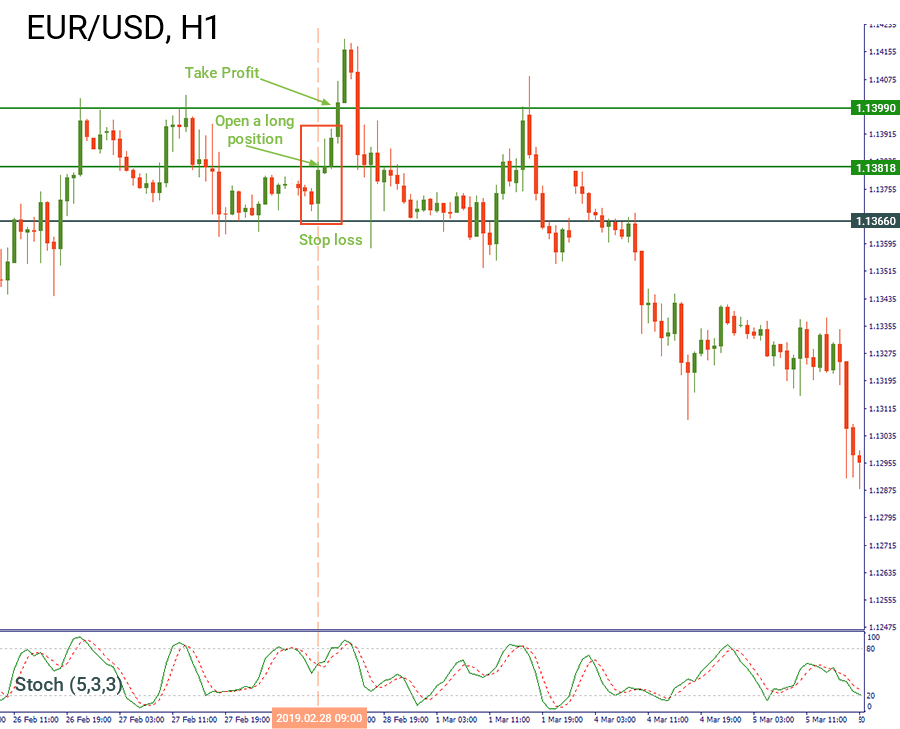
On the H1 chart of EUR/USD, we noticed that the low of the bullish candlestick inched lower than the low of the previous bearish one on February 28. The second candlestick confirmed the move to the upside and the stochastic is moving up. We opened a long position at the opening price at 1.13818. The level of stop loss is placed at the low of the first candlestick at 1.1366. We trailed the level of take profit and closed the position a little bit below the resistance level at 1.1399.
A short position’s setup
The scenario of opening a short position is similar to the one described above. Follow these steps:
- Wait for the bearish “Third candle” to be implemented.
- As with the long trade’s scenario, the bodies of the first and the second candles should not be small.
- The Stochastic oscillator should go down.
- We open a short position at the opening price of the third candlestick.
- We place a stop loss above the high of the first candlestick.
- We take profit when we suggest that the price may reverse to the upside soon (for example, strong support is reached or the crossover of the Stochastic indicator happens in the oversold zone).
The example of a short trade is shown in the chart below.
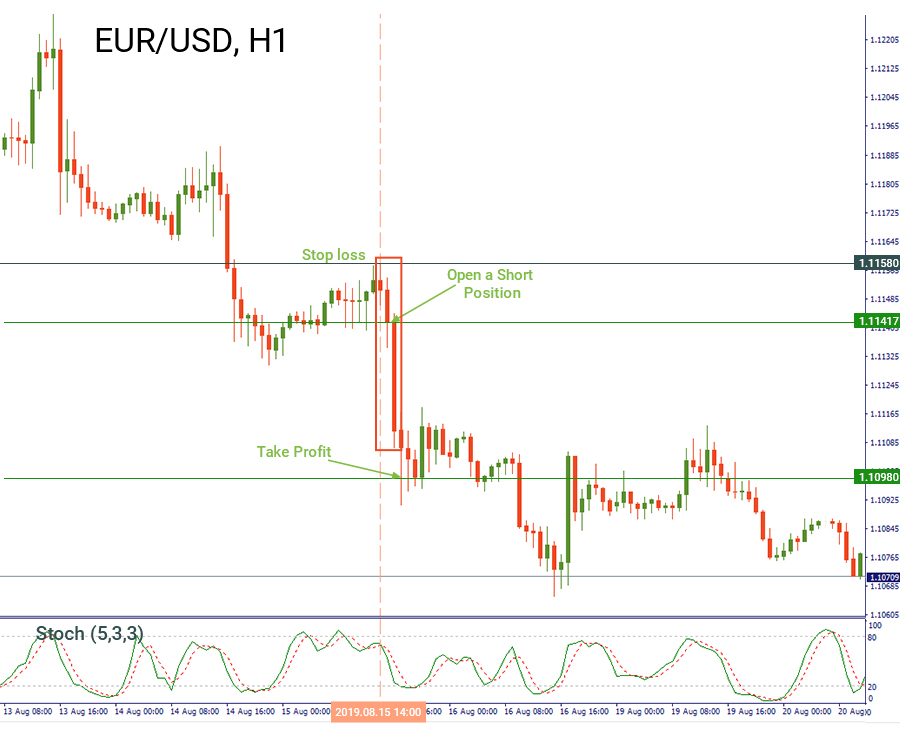
On the H1 chart of EUR/USD, we can see the formation of the "Third candle" pattern. Also, we noticed that the stochastic oscillator was moving down. We opened a short position at the opening price of the third candle at 1.1141. Stop loss is placed at the high of the first candlestick at 1.1158. We trailed our position and closed it when a stochastic oscillator was about to form a crossover within the oversold zone. We closed it at 1.1098.
Additional tips
- If the price stays at approximately the same level 5 bars after the entry, you need to close your position.
- It is not recommended to trade within 30 minutes before/after the important release (news).
Conclusion
The "Third candle" strategy represents an easy type of price action method. It is very understandable and may help with your intraday trading decisions.