Position trading strategies
Position trading is a type of trading that suits for super-patient, witty and long-sighted traders, who have a real feel for the markets. Their primary goal is to benefit from the dominant trends rather than from short-term market fluctuations. Typically, they use fundamental analysis for their trades, but sometimes they need to refer to technical tools as well. And one more key characteristic that defines position traders – they have sizable accounts to trade with.
There are at least two main advantages of position trading:
- While trading, you may capitalize on the interest differential, not only on your trades. This is due interest or swap is paid for the currency that is borrowed and earned on the one that is bought.
- Being a position trader you might benefit from the correlations that exist between currencies and other financial instruments.
In the following article, we are going to explore the strategies that encapsulate the two aspects of position trading mentioned above – swap and commodity correlations.
Strategy 1
For example, we have decided to trade CAD/JPY currency pair.
Canada is one of the world’s largest oil-producing nations; it is a well-known exporter of this commodity. So, the Canadian dollar normally rises when oil prices go up. In contrast, Japan is considered to be a net oil importer. This causes the yen to weaken when oil prices gain. This situation makes oil prices dynamic a leading indicator for the movement of CAD/JPY currency pair.
Strategy concept:
Timeframe – daily
Long trade’s setup:
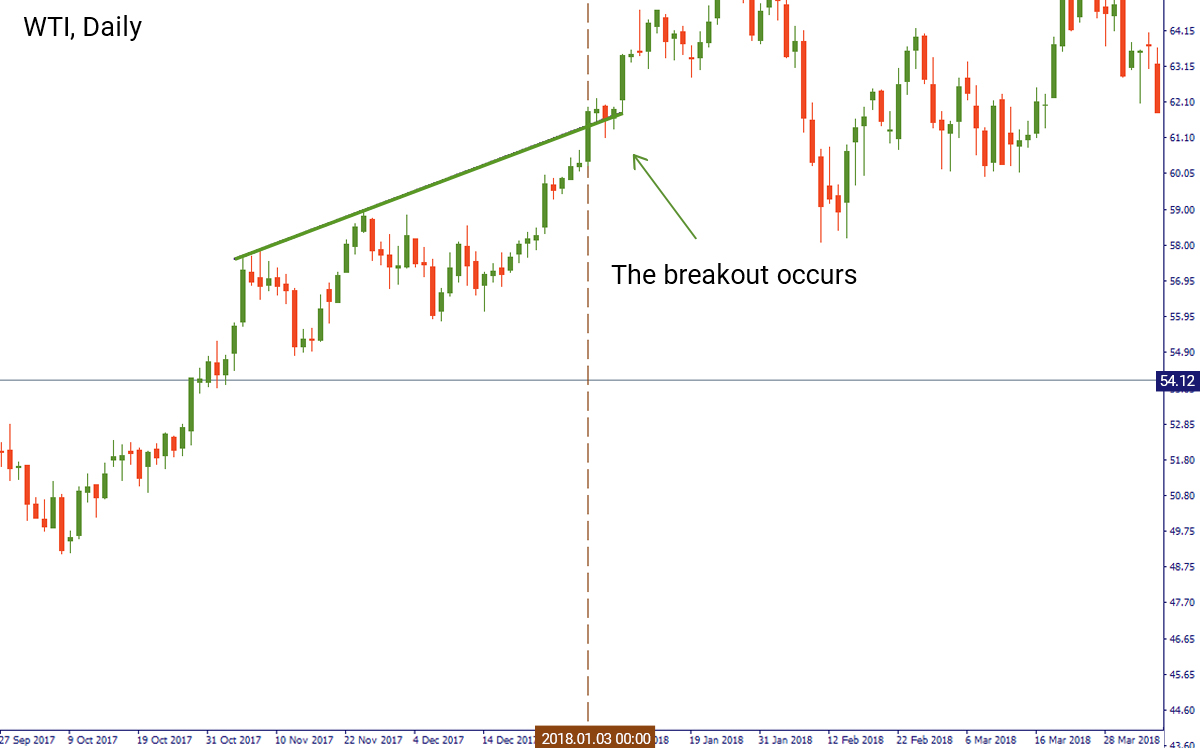
- At first, identify the resistance on the daily technical chart of oil futures;
- Find a candlestick that closes above the resistance;
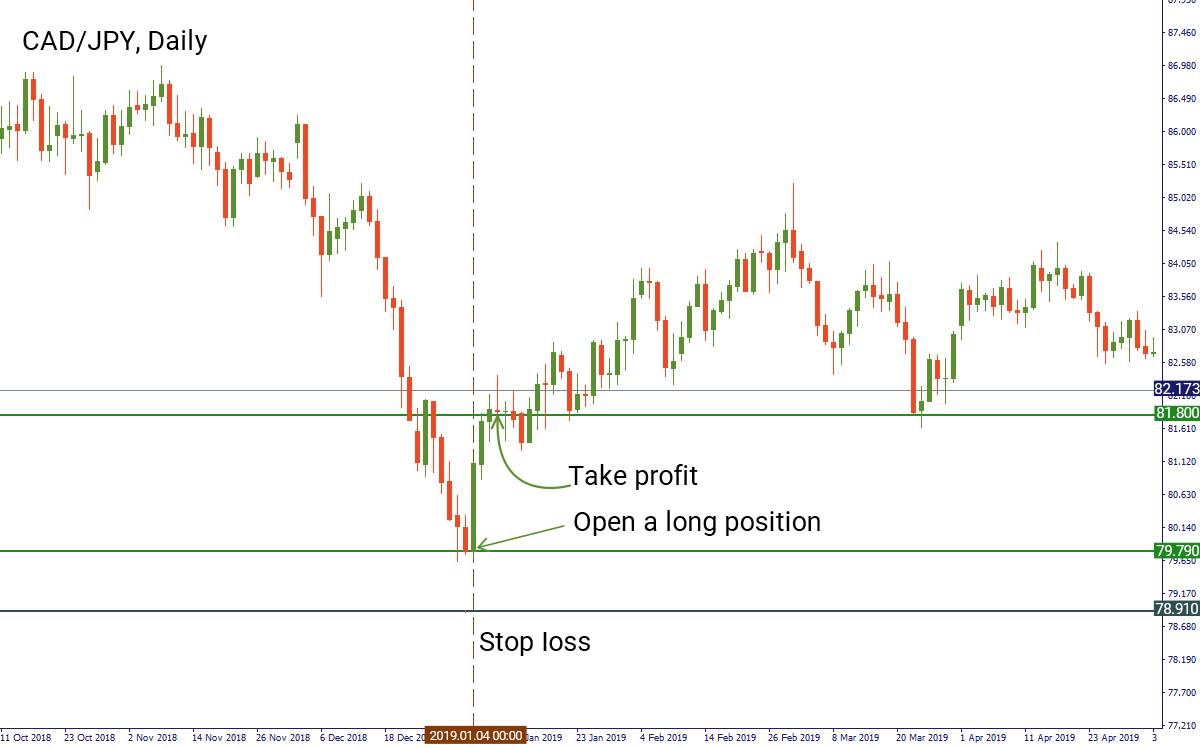
- Open a long position on CAD/JPY as soon as the next candlestick opens;
- Place a stop loss at the significant support level before entry.
- Set a take profit below the next significant resistance level after the entry.
Example:
On the daily chart of WTI, we identified an uptrend and were looking for a breakout of it. The candlestick which closed above the trend line occurred on January 3. After that, on January 4, we opened a long position for CAD/JPY at the opening price of a candlestick at 79.79. We placed a stop loss at the previous support level at 78.91 and take profit at 81.8.
Short trade’s setup
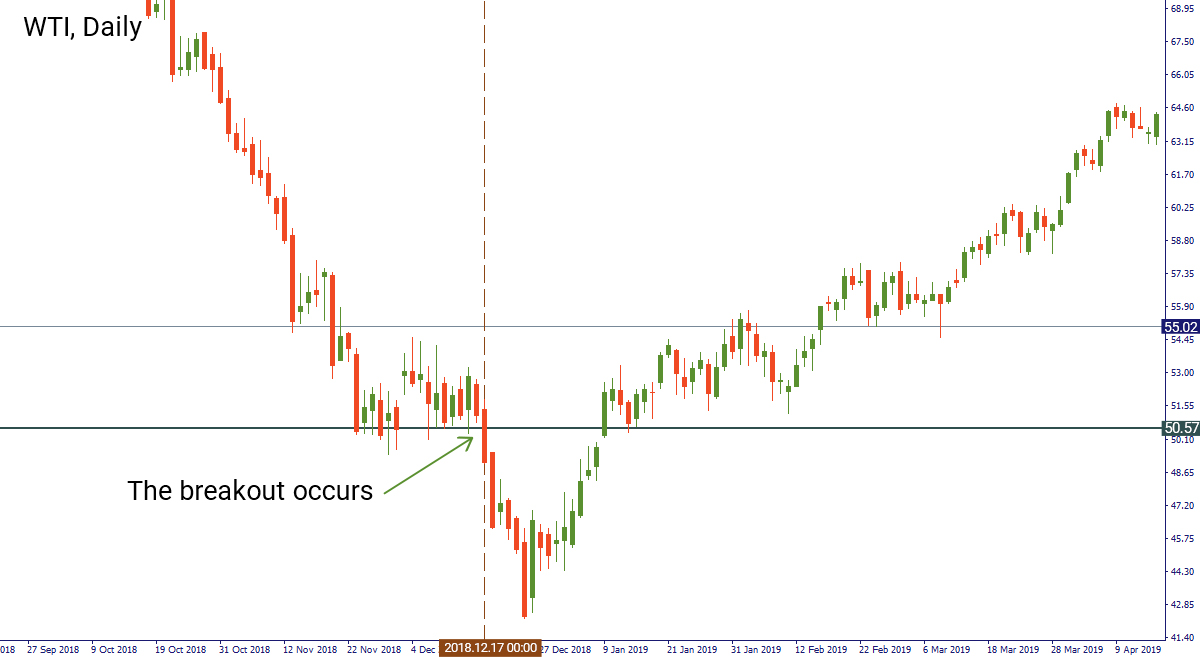
- Identify the support of the oil chart on the daily timeframe;
- Find a candle that closes below the support;
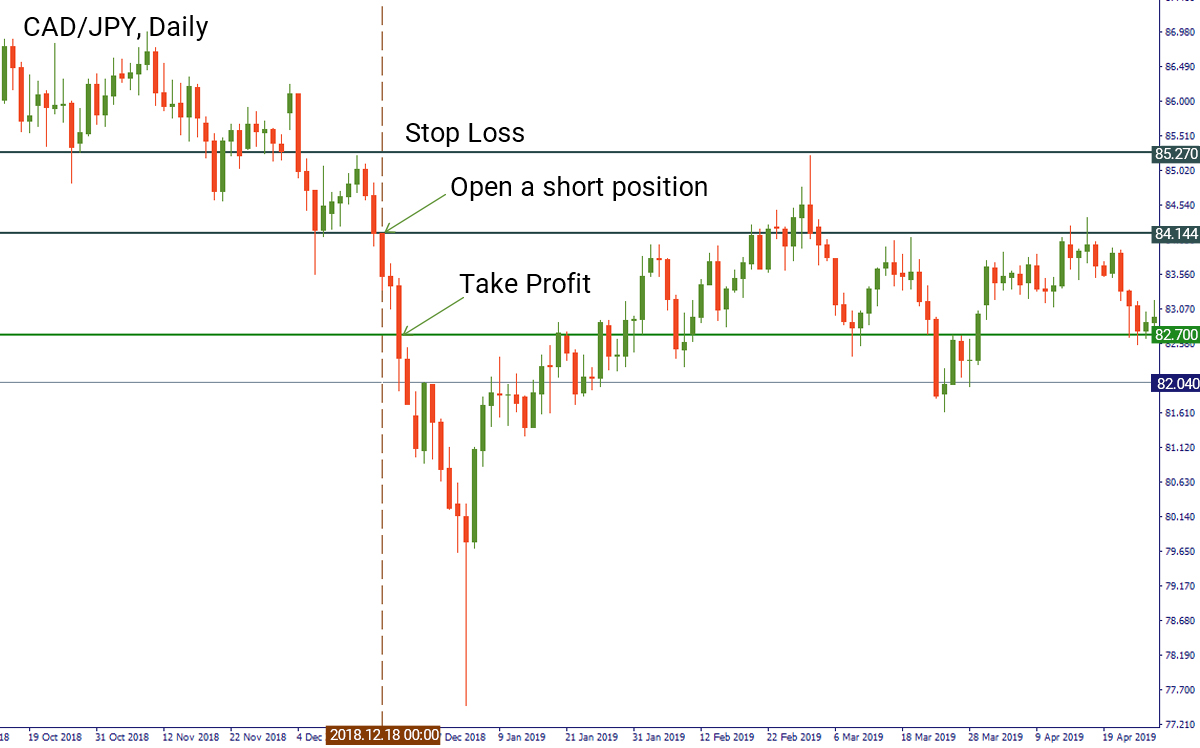
- Open a short position on CAD/JPY at the opening of the next candlestick;
- Place a stop loss at the significant resistance level before entry;
- Set a take profit below the next significant support level after the entry.
Example:
On the daily chart of WTI the price of crude has been consolidating above the support level at $50.57. We waited for a breakout of this level, which happened on December 17. After that, we switched to the chart of CAD/JPY. We placed a short order at the opening price of the candlestick on December 18 at $84.14. The stop loss for this position will be situated at $85.27, while the take profit goes at $82.7.
Strategy 2
The strategy that we are going to describe here explains the negative correlation between the US dollar index (the index measuring the value of the USD relative to the value of a basket of major currencies) and the price of gold. As a rule, the US dollar index falls, when gold rises.
Strategy concept:
Timeframe – daily
Long trade’s setup:
- Identify the support on the US dollar index chart (daily timeframe);
- Identify a candle that closes below the support;
- Open a long position on the chart of gold at the opening of the next candlestick;
- Place a stop loss at the significant support level before entry;
- Set a take profit below the next significant resistance level after the entry.
Example:
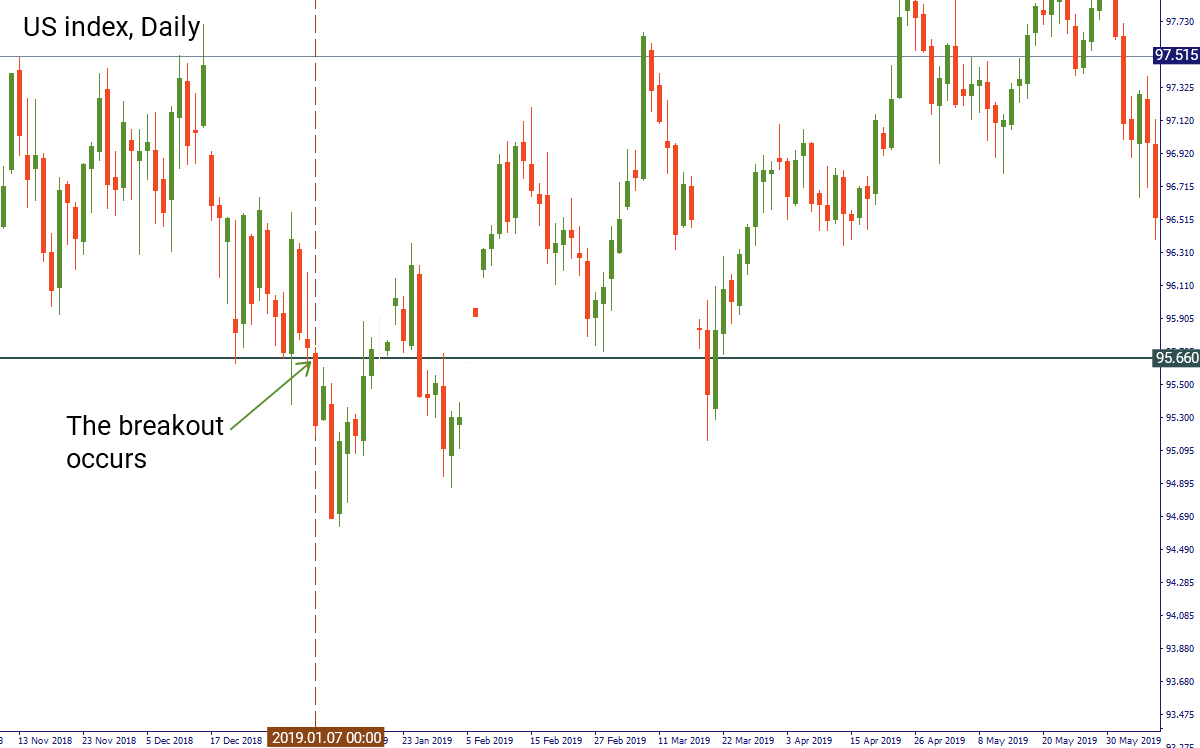
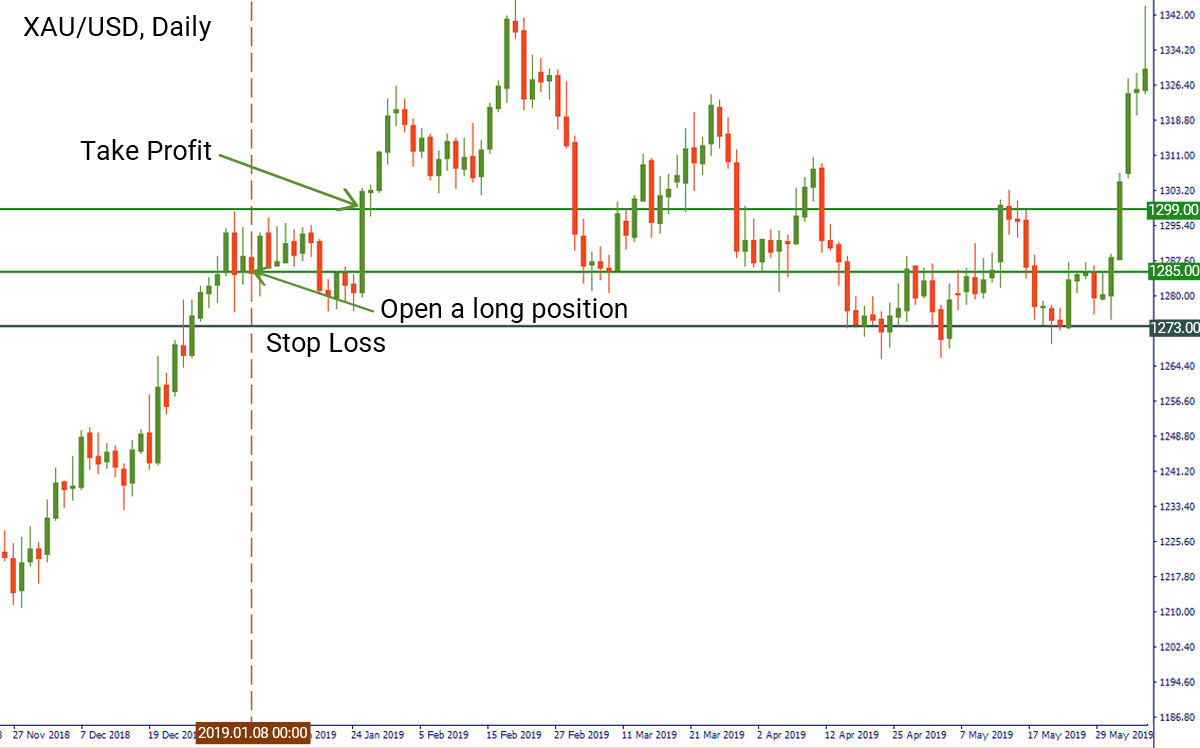
On the daily chart of the US dollar index, we noticed the breakout of the 95.66 support on January 7. After that, we opened the chart of gold and entered a long position at $1,285 on January 8. We placed the stop loss at the previous support level at $1,273. The take profit level will lie at $1,299 (a little bit below the resistance level).
Short trade’s setup:
- Identify the resistance on the US dollar index chart (daily timeframe);
- Identify a candle that closes above the resistance;
- Open a short position on the chart of gold at the opening of the next candlestick;
- Place a stop loss at the significant resistance level before entry;
- Set a take profit below the next significant support level after the entry.
Example:
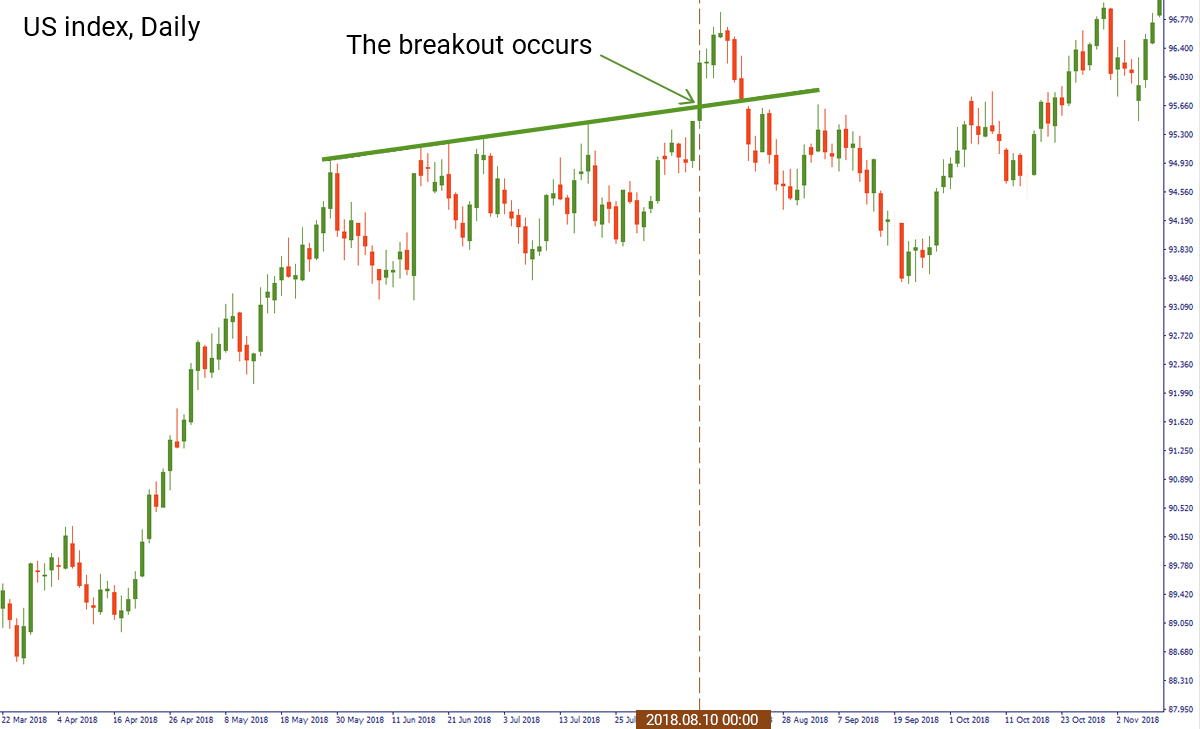
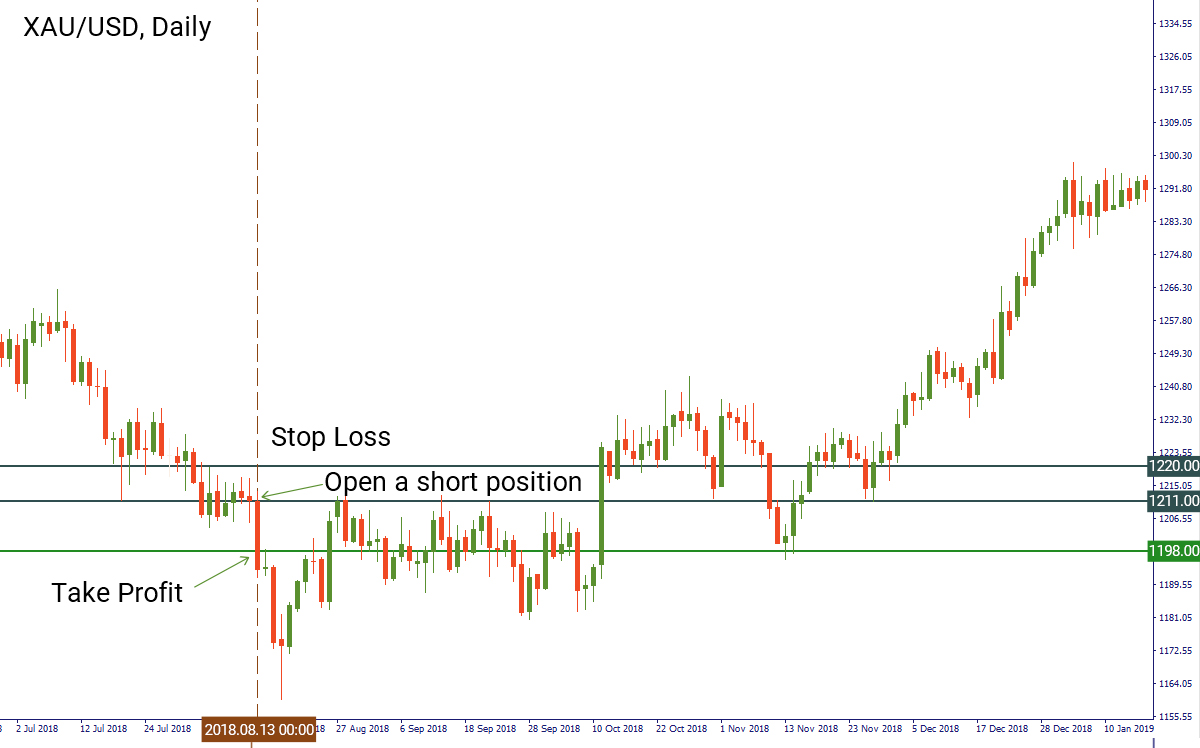
The situation when you need to open a short position is similar to the scenario with a long one. On August 10 (Friday), we identified a breakout of the resistance on the daily chart of the US dollar index. We switched to the chart of XAU/USD and entered a short position at the opening price of the candlestick on August 13 (Monday) at $1,211. We put the stop loss above the first resistance level before entry at $1,220. The level of take profit will lie at $1,198 (close to the support level).
Conclusion
Understanding correlations and fundamental analysis makes it easier for a position trader to catch the market’s movement and open a position at the right moment.
Source: The strategies retrieved from the book of "17 Proven Currency Trading Strategies" by Mario Sant Singh.