

Unemployment Rate and Nonfarm Payrolls: Why They Are So Important for the Markets
This article is about the nature of one of the most potent fundamental indicators, Nonfarm payrolls.
2023-01-26 • Updated
The universe works in cycles. Time works in cycles. Our planet works in cycles. Climate, biosphere, human development, political tensions, wars, your daily coffee – everything is set in motion in cycles. But make no mistake: nature doesn’t like replicas. So by cycles, we don’t mean a repetition of the same thing over and over again – regardless of the context. Rather, we mean that all things develop in stages. Including the stock market. How can you use it in your trade? Know how to recognize a coming shift to the next stage, make your bet, and win.
At the first sight, there are no cycles or stages in the recovery of the S&P. Just a straight, linear uptrend distorted by volatility like a weak radio-wave transmission. That’s one way to see it. Look closer.
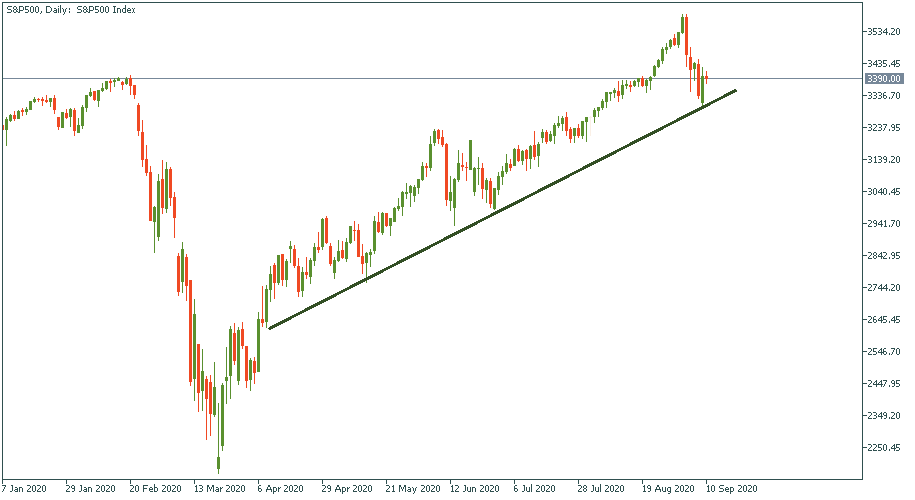
After examining the chart further, you will see that the path of the S&P’s recovery is somewhat binary, like a sequence of 0-1-0-1-0-1. After a clear rise, there is a period of contraction notable for lower highs and flat-firm support. There have been already three such sections, and it seems we are entering the fourth one. If it is true, then we will see intensified volatility within which there will be one of two highs lower than the last one, an overall sideways move across the support, and then another rise.
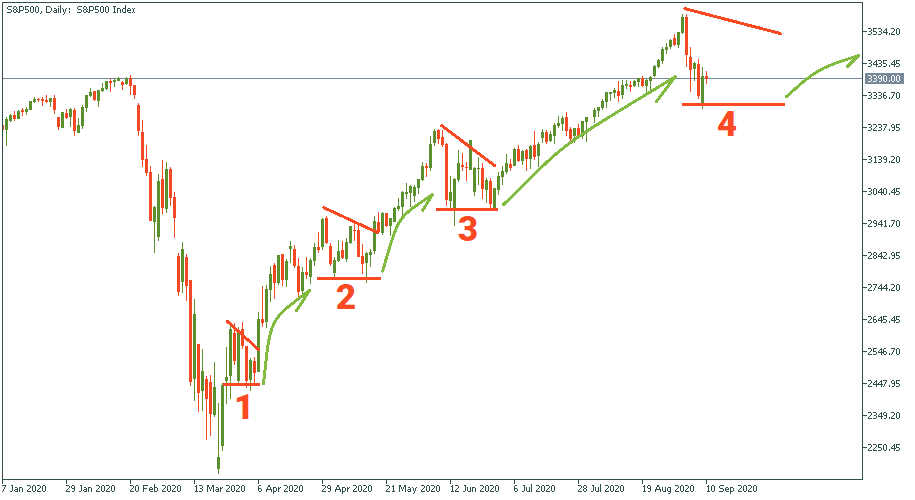
But is it certain that we will see such a period of volatility and lower highs before the S&P goes upwards again? No. We are in the process of verifying it right now, and it will take time. That’s why cycles here are not understood as identical periods when the chart repeats its formation evenly distributed across the timeline. Rather, we have an apparent pattern of contraction-expansion duality that unfolds in the S&P as the time goes by. The key is: we don’t take time as the basis for identifying which section we are in. Time is irrelevant. Instead, we identify it by comparing the logic of the movements to the previous periods. “But maybe that’s only applicable to the recovery!”. That may be – let’s check our duality hypothesis with a more strategic look at the S&P chart.
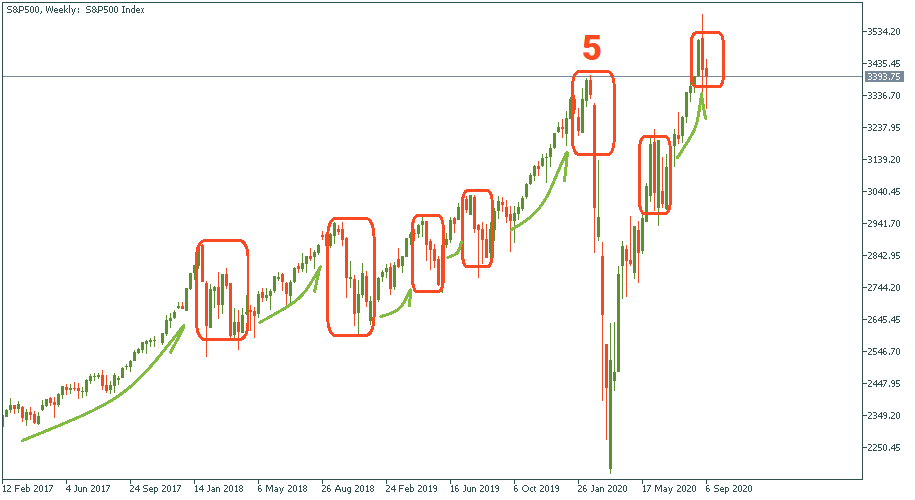
The last three years saw pretty much the same landscape of the S&P: an overall steady uptrend that sees alternating drops and rises. It is interesting to note that the fifth period where the crisis hit logically would see a drop anyways – it was “due” because the rising that preceded it was already long and high enough. From this point of view, the crisis immensely intensified the drop but did not force it onto the chart – it had to happen anyway. “But if the time and span of each period is different, how do we know what comes when?”. A fair question. First, although the span of drops and leaps vary, their length and smoothness revolves around average. That means, one rise takes two months, another one takes two, another one six, another maybe even a year, but there will be an average period during which the S&P normally follows a smooth uptrend before bumping into volatility and contraction. In the chart below, we see that the first arrow under the uptrend is almost one year long – from Feb 2017 to the end of 2017. But it is only one out of multiple such periods, and it is the only one that long. The rest are comparable in duration.
How do you use it: on your observed timeframe, measure all the spans of periods of rising, calculate the weighted average, and keep it in mind. The more the current uptrend deviates from this average, the more the probability is that it will end soon.
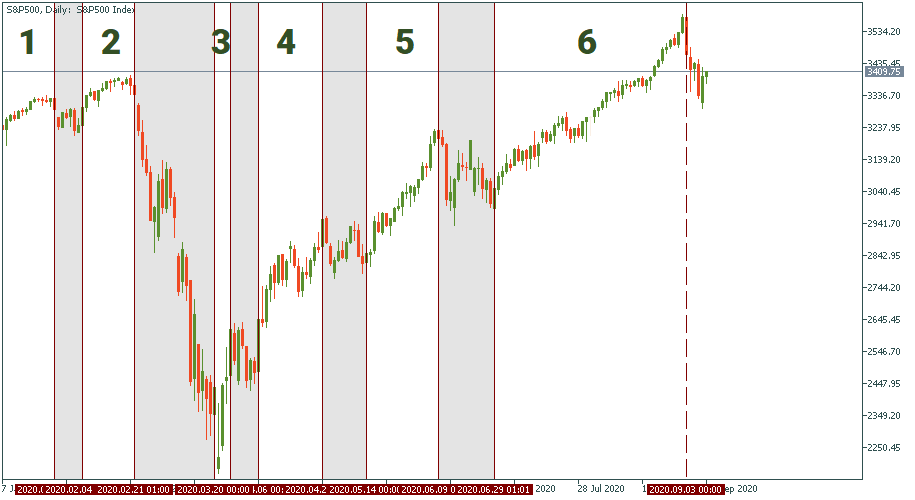
In the daily chart below, you have alternating periods of growth and decline by the S&P. Even visually, you can see that periods 1, 2, 4, 5 are pretty much similar in span. While periods 3 and 6 are definitely out of order: period 3 is way too short, and period 6 is way too long. How to calculate the weighted moving average based on these observations?
Let’s round up and assume that periods 1, 2, 4, and 5 had the same span. How much was it? 15 bars on average. So 4 period by 15 bars. Then we have one oddly short period spanning 3 bars and one extremely large period lasting 48 bars. Now, the math: 4*15 + 1*3 + 1*48 / (4+1+1) = 18.5. We can make it round to 18. So the weighted average length of a period of rising of the S&P in our chart is 18 bars.
How do we use this knowledge? After the current downfall, there will be another period of rising. Expect it to be more or less 18-bar long. If and once it extends beyond that – expected that a new downfall is imminent. And prepare.

This article is about the nature of one of the most potent fundamental indicators, Nonfarm payrolls.

In trading, we can rely on a bunch of different entry signals.

A triangle chart pattern is a consolidation pattern that involves an asset price moving within a gradually narrowing range.
Click the ‘Open account’ button on our website and proceed to the Personal Area. Before you can start trading, pass a profile verification. Confirm your email and phone number, get your ID verified. This procedure guarantees the safety of your funds and identity. Once you are done with all the checks, go to the preferred trading platform, and start trading.
If you are 18+ years old, you can join FBS and begin your FX journey. To trade, you need a brokerage account and sufficient knowledge on how assets behave in the financial markets. Start with studying the basics with our free educational materials and creating an FBS account. You may want to test the environment with virtual money with a Demo account. Once you are ready, enter the real market and trade to succeed.
The procedure is very straightforward. Go to the Withdrawal page on the website or the Finances section of the FBS Personal Area and access Withdrawal. You can get the earned money via the same payment system that you used for depositing. In case you funded the account via various methods, withdraw your profit via the same methods in the ratio according to the deposited sums.
FBS maintains a record of your data to run this website. By pressing the “Accept” button, you agree to our Privacy policy.
Your request is accepted.
A manager will call you shortly.
Next callback request for this phone number
will be available in
If you have an urgent issue please contact us via
Live chat
Internal error. Please try again later
Don’t waste your time – keep track of how NFP affects the US dollar and profit!
|


